Business analytics uses financial analytic tools to make better business decisions, but will also show you how to manage people through people analytics, will help you understand customers and markets through customer analytics, and will help you master logistics and supply chains through operation analytics.
The whole idea of customer analytics is a relatively new concept, while the overall idea of marketing has been around forever, there are so many cool and challenging data structures and technologies and decisions that firms are making and we want to help you get an understanding of them.
Let us consider the problem statement and we will find a solution using predictive analysis
Organization: A non-profit organization supported primarily by contributions from its benefactors
Challenge: Looking at benefactors’ histories of whether or not they gave each year, what can we predict about their future giving patterns?
Focal donors: Initial focus on 1995 cohort, ignoring donation amount
11,104 first-time supporters who made a total of 24,615 repeat donations over the next 6 years
HOW MUCH WILL DONORS GIVE IN THE FUTURE? HOW DOES IT DEPEND ON THEIR PAST PATTERNS?

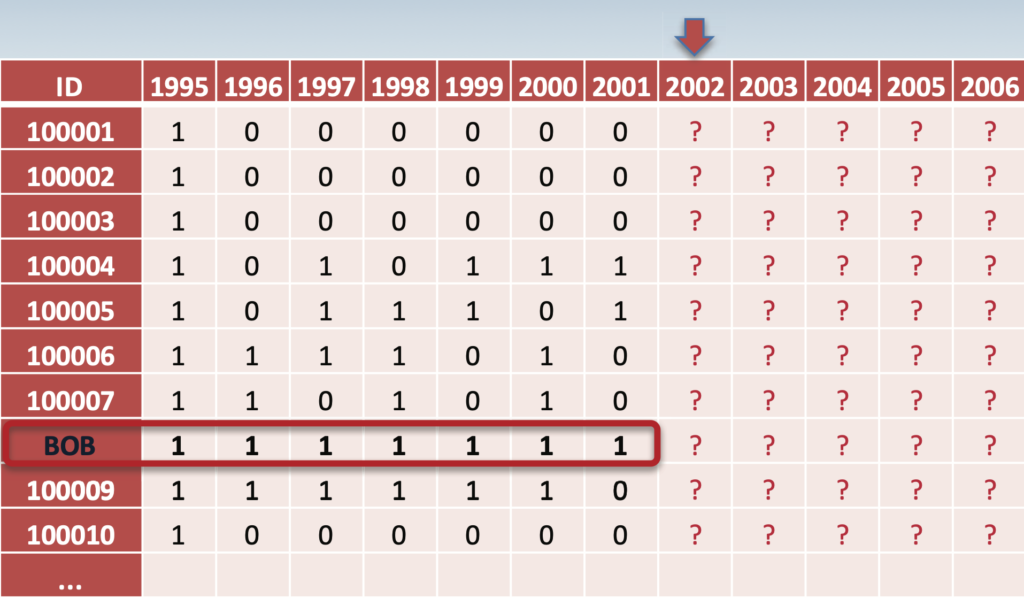
LET’S FIRST LOOK AT “BOB”:
WHAT CAN WE PREDICT ABOUT HIS GIVING IN 2002-06?
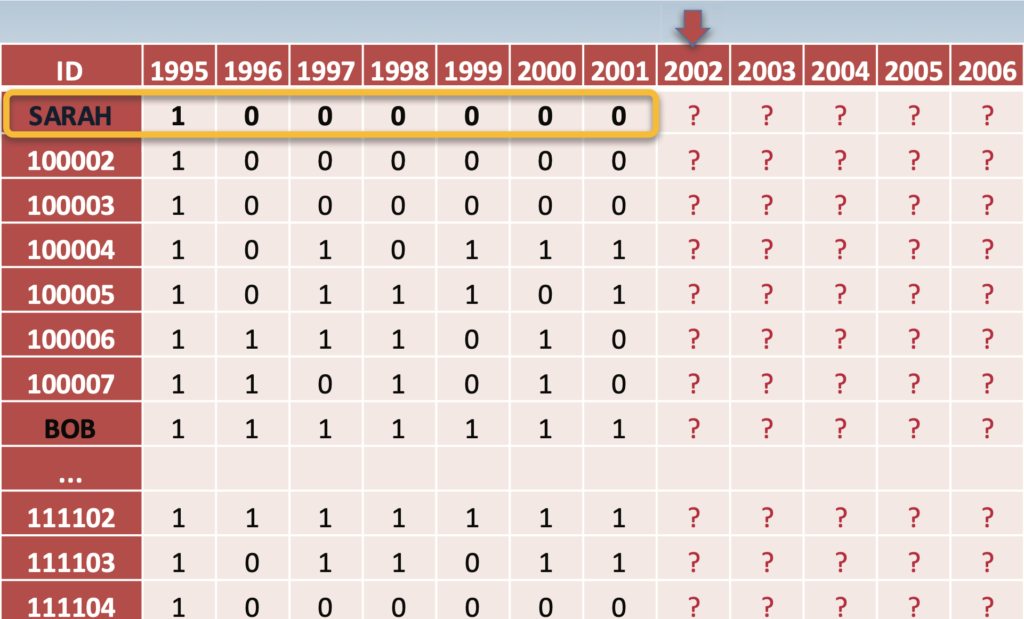
WHAT CAN WE TELL ABOUT “SARAH”?
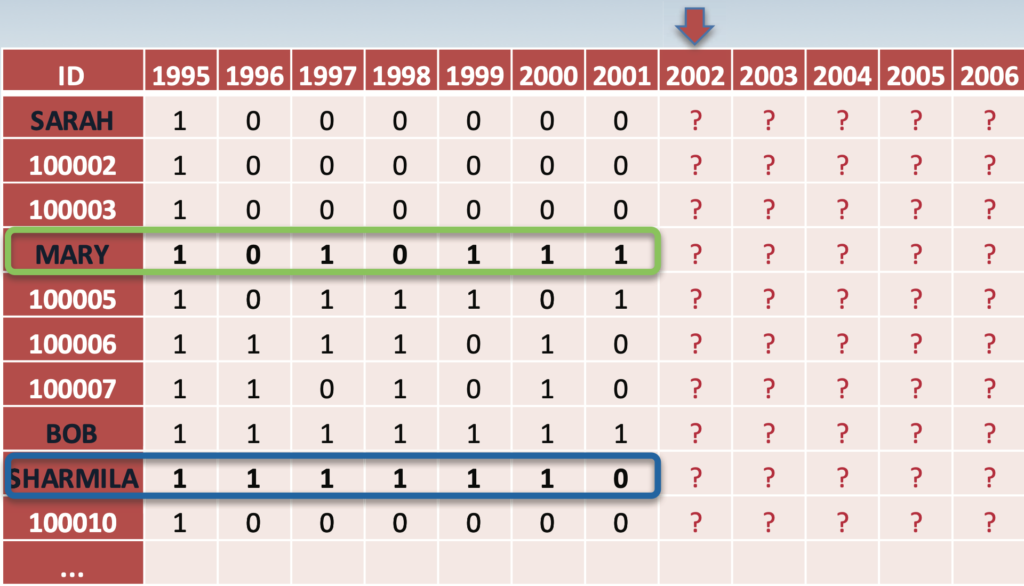
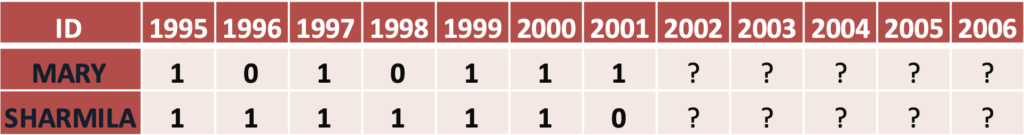
HOW DO “MARY” AND “SHARMILA” COMPARE?
WHAT DONATION BEHAVIOR CHARACTERISTICS DO WE NEED TO TAKE INTO ACCOUNT?
GIVING BEHAVIORS
RECENCY: How recently did the donor give? When was the last time the donor gave?
FREQUENCY: How many times did the donor give in the past 6 years?
Most meaningful donation patterns can be described by these two metrics alone.
DONOR TYPES
A L I V E : Clearly an active donor: giving frequently and gave recently
DORMANT: Has not given recently, but is likely to give again with the right development prompts
LAPSED: Has not given recently and is not likely to give again
LET US LEARN MORE ABOUT RECENCY AND FREQUENCY
Y Y N N N N
Y Y N N Y Y
What does it mean when there,s one or more “no donation” at the end of a sequence?
- a) The donor lapsed (i.e., left the donor pool)
- b) The donor is dormant (i.e., decided not to give that year, didn,t think ofgiving, etc.)
- c) We don,t know, but can build a model to come up with a “best guess”
Answer: c) We never know for sure whether the donor is lapsed or not; based on recency and frequency of his donation, we can make an educated guess about the probability of lapsing, so we can decide where to devote resources
Based on our best guesses about the probability of “death” and propensity to donate, we can calculate expected frequency of future donations for each donor
WHAT ABOUT “MARY” VERSUS “CHRIS”?
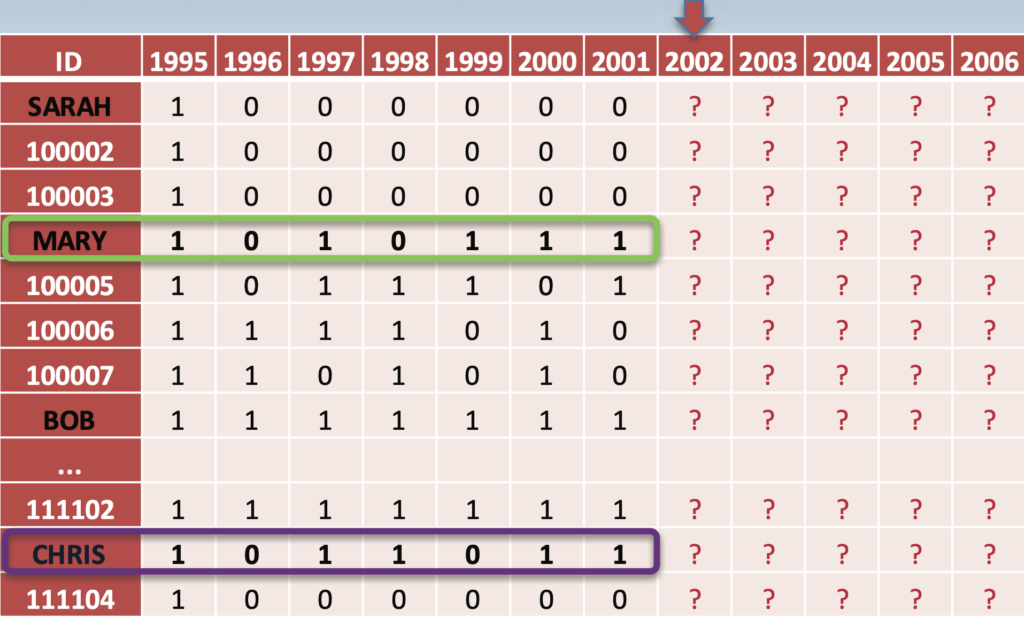
Look, the fact is, that Mary and Chris both gave most recently and both R (Recency) and F (Frequency) are same. We know that they were alive last period, we know that they were alive at the period before that. But in some cases, if we don’t have really good information to do that sorting out, we might as well go with a tie, and I think that would be appropriate in the case of Mary and Chris.
“BUY TILL YOU DIE” MODEL
We employ a “Buy Till You Die” model to predict future donation behaviors
The model only uses three inputs:
1. Recency (R)
2. Frequency (F)
3. Number of people for each combination of R/F
This requires a small amount of data and provides an easier structure to work
with (i.e., data are aggregated from individual-level to R/F groups)
By assuming certain probability distributions for donors, propensities, we can
construct a robust model that is easy to implement on Excel
This “BTYD” modeling approach has a long track record of success in a variety of different domains