What is numpy.log()?
numpy.log() is a mathematical function that helps user to calculate Natural logarithm of x where x belongs to imput array elements. The natural logarithm log is an inverse of exponential function log(exp(x)) = x. It is a logarithm of base ‘e’. It calculates the mathematical log of any number or array.
Syntax:

Parameters:
3 parameters of np.log are x, out and where.
out and where are rarely used.
x provide input to function. This parameter accepts array like objects as input. Like it will also accept Python list as input.
How to use np.log() in Python?
First we have to import numpy module using the command.
import numpy as np
Now the numpy module is imported.
np.log with a single number:
We will try to apply log on numbers and on mathematical constant e, Euler’s number.
import numpy as np
np.log(2)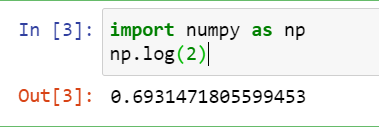
import numpy as np
print(np.e)
np.log(np.e)
What will happen if we use log on 0?
Lets see what happens
import numpy as np
print(np.log(0))
Calculating log with base 2 and base 10:
import numpy as np
print(np.log2(8))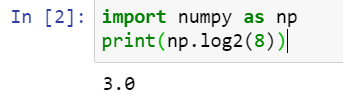
import numpy as np
print(np.log2(30))
import numpy as np
print(np.log10(30))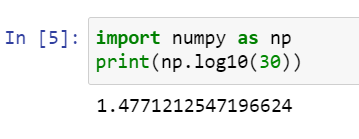
import numpy as np
print(np.log10(100))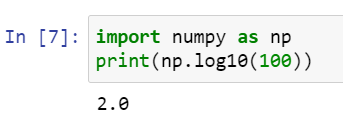
Calculating log on 1D array:
To calculate the logarithm of a 1D array:
import numpy as np
np.log([3,4,5,7])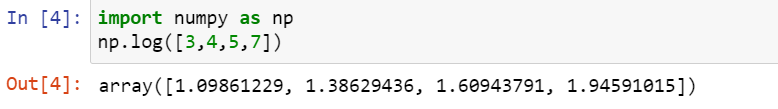
import numpy as np
arr1=np.array([1,3,5,5**3])
print(arr1)
arr2=np.log(arr1)
print(arr2)
arr3=np.log2(arr1)
print(arr3)
arr4=np.log10(arr1)
print(arr4)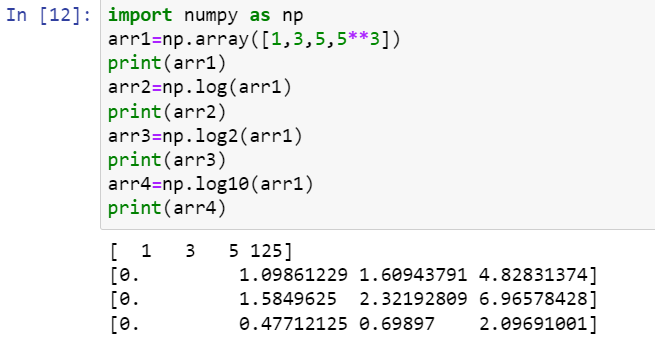
Calculating log on 2D array:
To calculate the logarithm of a 2D array:
import numpy as np
nparray = np.arange(1,10).reshape(3,3)
print("Original np 2D Array:\n",nparray)
print("\n Logarithmic value of 2D np array elements:\n",np.log(nparray))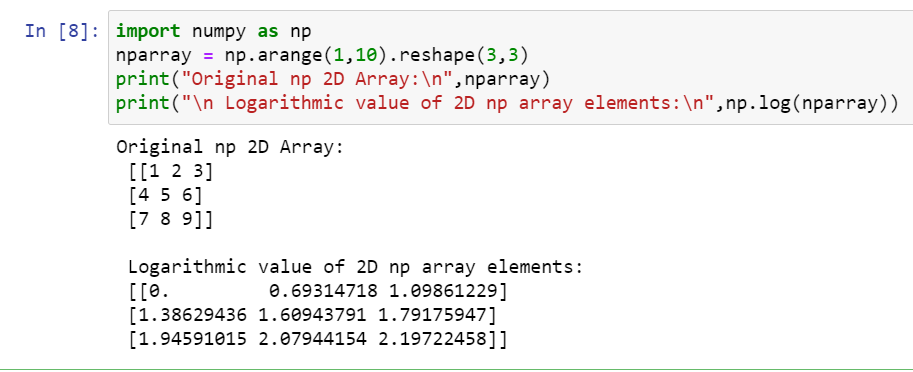
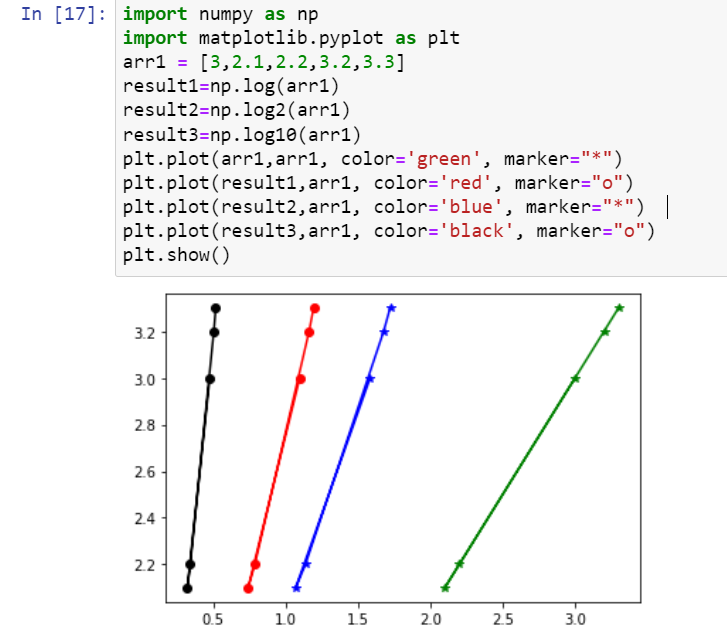
Plotting log using matplotlib:
Let’s try plotting a graph for the logarithmic function using matplotlib. If you are not familiar with matplotlib, we have a separate article on this check here.
import numpy as np
import matplotlib.pyplot as plt
arr1 = [3,2.1,2.2,3.2,3.3]
result1=np.log(arr1)
result2=np.log2(arr1)
result3=np.log10(arr1)
plt.plot(arr1,arr1, color='green', marker="") plt.plot(result1,arr1, color='red', marker="o") plt.plot(result2,arr1, color='blue', marker="")
plt.plot(result3,arr1, color='black', marker="o")
plt.show()