Why user activities data is tremendously valuable?

Brief Introduction:

Recommender Systems have taken more and more place in our lives from the last few decades, with the rise of YouTube, Amazon, Netflix and many other such web streaming platform i.e., from e-commerce (suggest to buyers articles that could interest them) to online advertisement (suggest to users the right contents, matching their preferences), recommender systems are today unavoidable in our daily online journeys.

Recommender Systems are really critical in some industries as they can generate a huge revenue and also helps to stand out significantly from competitors. There are many success stories of recommender systems, to mention a few, a few years ago, Netflix organised challenges (the “Netflix prize”) with a prize of 1 million dollars to win, where the goal was to produce a recommender system that performs better than its own algorithm.

In this article, we will go through different paradigms of recommender systems. For each of them, we will present how they work, describe their theoretical basis and metrics to evaluate the performance of recommender system.

What is a Recommender System?

Recommender System captures the pattern of people’s behaviour and use it to predict what else they might want or like.

In a nut shell, recommender systems are algorithms hired to suggest relevant items to users (items being movies to watch, text to read, products to buy or anything else depending on industries).

Applications:-

  • What to buy.
  • Where to eat.
  • Which job to apply to.
  • Who you should be friends with.
  • Personalize your experience on the web.

Advantages of Recommender Systems:-

  • Broader exposure.
  • Possibility of continual usage or purchase of products.
  • Provides better experience.

Types:-

There are mainly three types:

i) Content-Based methods.

ii) Collaborative Filtering methods.

Further divided into two types

-> memory-based,

-> model-based

iii) Hybrid methods.

Implementing Recommender Systems:

Memory-based:-

Uses the entire user-item data set to generate a recommendation, uses statistical techniques to users or items.

example:- Pearson correlation, Cosine similarity, Euclidean distance etc.,

Model-based:-

Develops a model of users in an attempt to learn their preferences.

Models can be created using Regression, Clustering, Classification which are machine learning techniques.

Content-based Filtering:-

It recommends users based on the items they liked and recommends similar items to user that they might like it.

Figures out user’s favourite aspects of an item is, then recommends.

“Show me more of the same of what I have liked before” -> content-based

How it works?

Take a look at user’s data:

input user rating:

A2
B10
C8
user ratings for different movies A, B, C.
ComedyAdventureSuper heroSci-fic
A0110
B1111
C1010
One-hot encoded movies matrix generated from weighing the genres.

Multiply input user ratings and genre matrix to get the user profile.

ComedyAdventureSuper heroSci-fic
A0220
B10101010
C8080
Weighted genre matrix.
ComedyAdventureSuper heroSci-fic
18122010
0.30.20.330.16
Sum up all the individual Genres to get the above table.

With these information we are going to see how to predict for a new movie. Before that see the user profile.

ComedyAdventureSuper heroSci-fic
User0.30.20.330.16
User profile.

Movies matrix

ComedyAdventureSuper heroSci-fic
1101
0010
1010
The above table is a input user ratings.

Convert the above user input ratings to weighted movies matrix.

0.30.200.16
000.330
0.300.330
Weighted movies matrix.

To get the recommendation matrix take the summation of individual row from the weighted movies matrix. This matrix would assist algorithm to make recommendations to the users by considering weighted average. Like if the average is less it would not recommend if average is high good chances for the item being recommended to the user.

0.66
0.33
0.63
Recommendation matrix.

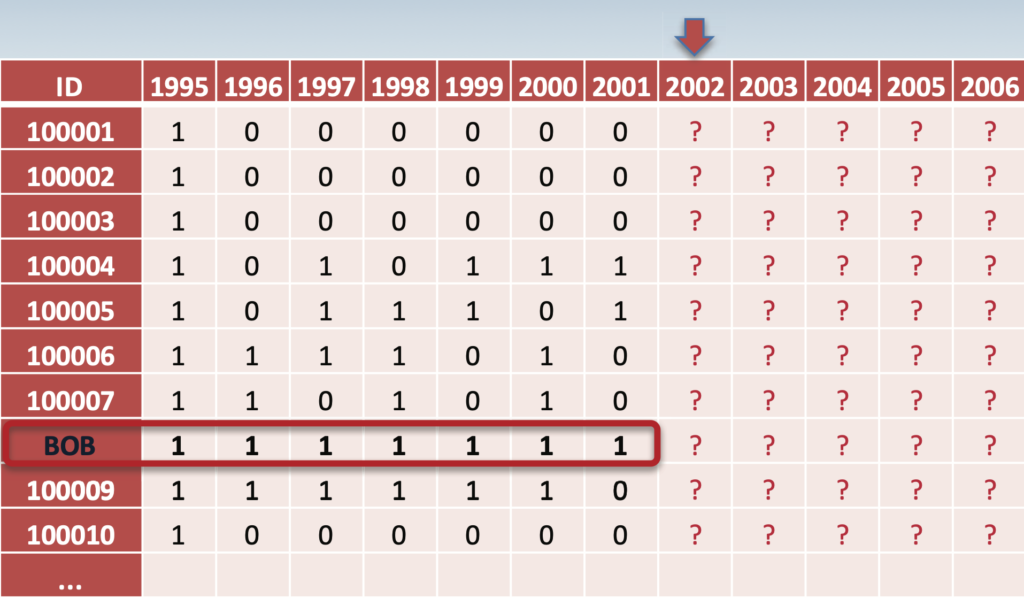
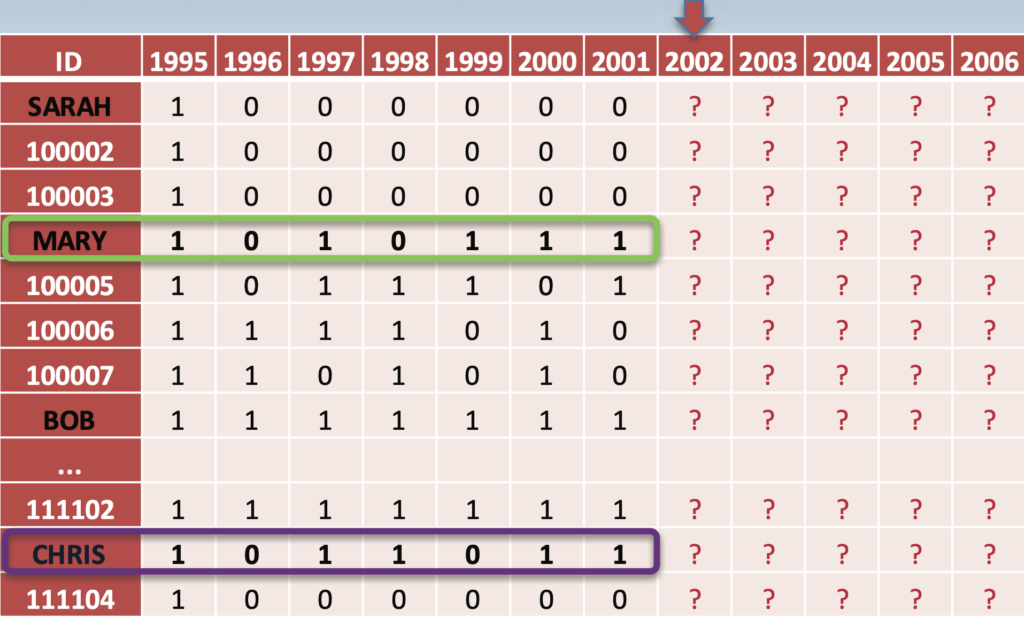
Collaborative Filtering:-

Recommends what is popular among the user neighbour’s and recommends the same item to the user so they might like it.

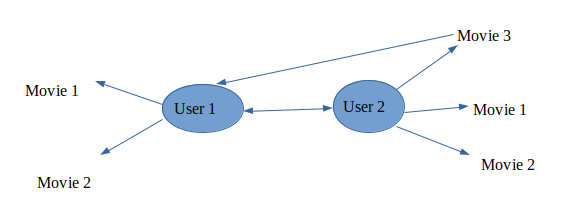
Makes recommendations based on users of same neighbourhood.

Two types:

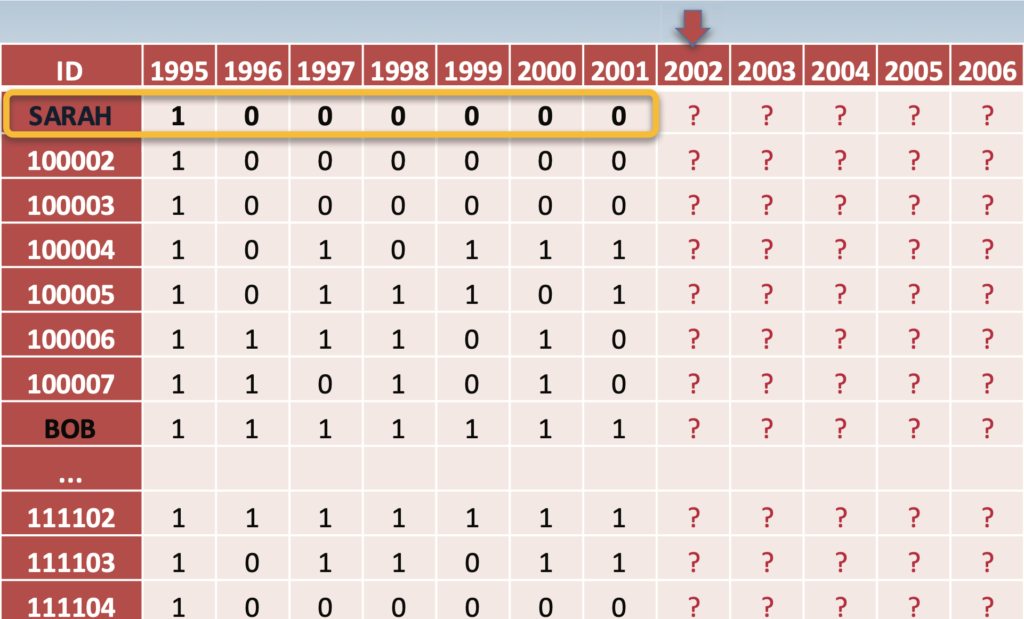
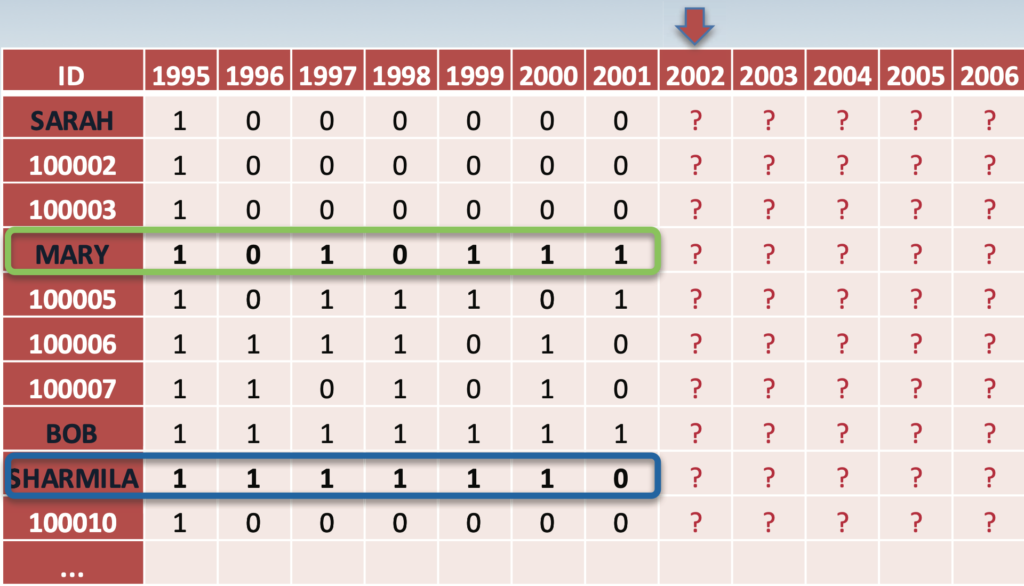
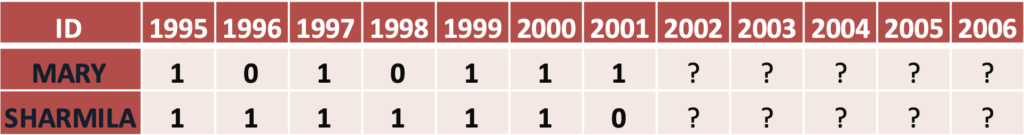
i) User-based collaborative filtering: It is based on user’s neighbourhood.

ii) Item-based collaborative filtering: Based on item’s similarity.

Collaborative filtering makes recommendations based on users of same neighbourhood, with whom he/she shares a common preferences and vice-versa for item-based collaborative filtering.

Challenges of Collaborative filtering:

Data Sparsity:- Users in general rate only a limited number of items.

Cold start:- Difficulty in recommendation to new users or new items.

Scalability:- Increase in number of users or items.

Why Customer Analytics is prime to make better business decisions?

Business analytics uses financial analytic tools to make better business decisions, but will also show you how to manage people through people analytics, will help you understand customers and markets through customer analytics, and will help you master logistics and supply chains through operation analytics.

The whole idea of customer analytics is a relatively new concept, while the overall idea of marketing has been around forever, there are so many cool and challenging data structures and technologies and decisions that firms are making and we want to help you get an understanding of them.

Let us consider the problem statement and we will find a solution using predictive analysis

Organization: A non-profit organization supported primarily by contributions from its benefactors

Challenge: Looking at benefactors’ histories of whether or not they gave each year, what can we predict about their future giving patterns?

Focal donors: Initial focus on 1995 cohort, ignoring donation amount

11,104 first-time supporters who made a total of 24,615 repeat donations over the next 6 years

HOW MUCH WILL DONORS GIVE IN THE FUTURE? HOW DOES IT DEPEND ON THEIR PAST PATTERNS?

LET’S FIRST LOOK AT “BOB”:
WHAT CAN WE PREDICT ABOUT HIS GIVING IN 2002-06?

WHAT CAN WE TELL ABOUT “SARAH”?

HOW DO “MARY” AND “SHARMILA” COMPARE?

WHAT DONATION BEHAVIOR CHARACTERISTICS DO WE NEED TO TAKE INTO ACCOUNT?

GIVING BEHAVIORS

RECENCY: How recently did the donor give? When was the last time the donor gave?

FREQUENCY: How many times did the donor give in the past 6 years?

Most meaningful donation patterns can be described by these two metrics alone.

DONOR TYPES

A L I V E : Clearly an active donor: giving frequently and gave recently

DORMANT: Has not given recently, but is likely to give again with the right development prompts

LAPSED: Has not given recently and is not likely to give again

LET US LEARN MORE ABOUT RECENCY AND FREQUENCY

Y Y N N N N

Y Y N N Y Y

What does it mean when there,s one or more “no donation” at the end of a sequence?

  1. a)  The donor lapsed (i.e., left the donor pool)
  2. b)  The donor is dormant (i.e., decided not to give that year, didn,t think ofgiving, etc.)
  3. c)  We don,t know, but can build a model to come up with a “best guess”

Answer: c) We never know for sure whether the donor is lapsed or not; based on recency and frequency of his donation, we can make an educated guess about the probability of lapsing, so we can decide where to devote resources

Based on our best guesses about the probability of “death” and propensity to donate, we can calculate expected frequency of future donations for each donor

WHAT ABOUT “MARY” VERSUS “CHRIS”?

Look, the fact is, that Mary and Chris both gave most recently and both R (Recency) and F (Frequency) are same. We know that they were alive last period, we know that they were alive at the period before that. But in some cases, if we don’t have really good information to do that sorting out, we might as well go with a tie, and I think that would be appropriate in the case of Mary and Chris.

“BUY TILL YOU DIE” MODEL

We employ a “Buy Till You Die” model to predict future donation behaviors

The model only uses three inputs: 

1. Recency (R)

2. Frequency (F)

3. Number of people for each combination of R/F
This requires a small amount of data and provides an easier structure to work

with (i.e., data are aggregated from individual-level to R/F groups)
By assuming certain probability distributions for donors, propensities, we can

construct a robust model that is easy to implement on Excel

This “BTYD” modeling approach has a long track record of success in a variety of different domains

Why Data Scientist is the sexiest job among millennials?

As of now, there is a demand and cry about the shortage of data scientists, with data science being one of the most lucrative career paths. At the end of this article, you’ll have a better understanding of what exactly is Data Science.

Data Science is a process, not an event. It is the process of using data to understand different things, Data Science is an art of uncovering the insights and trends that are hiding behind data and translate the data into a story. So use storytelling to generate insights with these insights, you can make strategic choices for a company or an institution.

‘Data Science is the study of Data’ like example ‘Physical Sciences is the study of inanimate natural objects’. Data Science deals with both Structured and Unstructured form of data. Data is real, Data has real properties, and we need to understand and study them if we’re going to work on them.

“Data Science is the field of exploring, manipulating, and analyzing data and using data to answer questions or make recommendations”.

We can also define Data Science as one’s attempt to work with data, to find answers to questions that they are exploring. In a nutshell, it’s more about data than it is about

science. If you have data, and you have curiosity and you’re exploring data, and you’re manipulating it, the very first exercise of going through analyzing data, trying to get some answers from Data is Data Science.

Data Science is relevant today because we have tons of data available, previously we used to worry about lack of data but now we have data deluge. In the past, we didn’t have algorithms, now we have algorithms. In the past the software was expensive, now it’s open-source and free. In the past, we couldn’t store large amounts of data, now for a fraction of cost, we can have gazillions of data sets for a very low cost. So, we have tools to work with data, and the ability to store and analyze data, it’s all cheap, it’s all available. There’s never been a better time to become a Data Scientist.

As a Data Scientist, you get to work on a broad spectrum of projects like

•Building recommendation engine.

•Analyzing 1000’s of 100,000’s of complaints filed by customers.

•Using neural network to classify bacteria.

The many paths to Data Science:

As Data Science is not a discipline traditionally taught at universities, contemporary Data Scientists come from

diverse backgrounds such as Engineering, Statistics and Physics. The secret skill is a passion for continuous learning of new technologies and tools and patience to clean and analyze data. There are many resources available over the internet to learn Data Science and most of them were free of cost requires internet and demands a passion to learn new things with some commitment.

The final deliverables of the data science project would be:

  1. A description of the problem and a discussion of the background.

2. A description of the data and how it will be used to solve the problem.

3. A full report consisting of all of the following components

  • Introduction where you discuss the business problem and who would be interested in this project i.e., targeted audience.
  • Data where you describe the data that will be used to solve the problem and the source of the data from where you are importing.
  • Methodology section which represents the main component of the report where you discuss and describe any exploratory data analysis that you did, any inferential statistical testing that you performed if any, and what machine learnings were used and why.
  • Results section where you discuss the results.
  • Discussion section where you discuss any observations you noted and any
  • Recommendations you can make based on the results.
  • Conclusion section where you conclude the report.

Field Symbols

Field Symbols

Field Symbols are used to address the fields indirectly. The functionality of the Field Symbols corresponds to the functionality of the pointers in other programming languages.

The declaration of Field Symbols is as shown below,

FIELD-SYMBOLS <fs> Type type

There are four different possibilities to define data type of field symbols

  • Reference to a built-in data type
  • Reference to the ABAP dictionary
  • Reference to a pre-defined type
  • Reference to a generic type

Built-in Type:

Field-Symbols  <fs-char> Type C

ABAP Dictionary:

Field-Symbols  <fs-dict> Type tablename

Predefined Type:

Field-Symbols  <fs-pr> Type ty-pre

Generic Type:

Creating Data Objects dynamically

  1. Field-symbols, data references are declared
  2. Data reference is created with a particular data type
  3. The address of the data reference is assigned to the field symbol

Field-Symbols <fs-table1> Type Standard table

Data: lr-ref Type ref to data

Data l_table_name type tabname.

L_table_name= `Z-Table´.

Create data lr_ref type standard table of l_table_name.

Assign lr_ref-> *To <fs-table1>

SELECT * From <l_table_name> INTO Corresponding fields of Table <fs-table1>

The initial assignment of field symbol to a data object succeeds with the “Assign” command.

Assign Dataobject to <fs-example>

Field Symbols are mainly used to improve the performance during runtime. Data should not be copied to the work area.

Data l_int1 Type i value 1,

Field-Symbols <fs-int> Type i.

Assign l_int1 to <fs-int>

<fs-int> = 2 => which automatically sets l_int1 = 2

Common Address

Note: Field-Symbols must always be assigned to a data object before we proceed with any operations. Otherwise, it gives an error during runtime.

Class Builder

The ABAP classes, exception classes and interfaces are created using the Class Builder. The Class Builder is called through the SE24 Transaction.

  • Name:  Provide a corresponding class name.
  • Class type: There are four different types of ABAP classes.
    • Usual ABAP classes
    • Exception classes
    • Persistent classes
    • Test classes
  • Final check option:  Enabling this option ensures that no other classes can inherit this class.
  • Accessibility of the class: The accessibility of the class is controlled through options such as private, public, protected
  • Inheritance option

Once all the above details are filled up, the save button can be clicked.

Inheritance:

The Inheritance is achieved through two ways. One way is through the creation dialog box while creating the class. The class to be inherited is given in the input filed for Inherited class. The other way is through properties tab. The Inherited class is entered in the respective field.

Figure 1 Inheritance

Interfaces:

The interfaces is used to accomplish a unified approach to access the class type. The interface can be defined in three different ways as shown in below figure

Figure 2 Interfaces

With the Abstract type of interface, the methods cannot be implemented. The Final option ensures that it cannot be inherited. The components cannot be accessed during the runtime.

Friends:

It serves for the foreign classes which can access the private and protected components of the class. The class can be entered in the friends tab.

Attribute:

The attributes for the class can be defined in the following ways.

Figure 3 Attribute definition

Method definition:

The method can be defined in the following ways.

Figure 4 Method definition

Method Exception:

The exceptions for the method are controlled throughout the exception button. Place the cursor in the corresponding method and click exception button to enter the exceptions. The exceptions are of two types. They are local exceptions and global exceptions.

Method Redefinition:

The methods are defined using the redefinition option available on the top of the method table. The Redefinition of the method can be easily revoked using the Remove Redefinition option on top of the method table.

The inherited method or the super class method can be called using

super -> name_der_method().

Method parameters:

Figure 5 Method parameters

Events:

The events can be specified for the class using the tab events. Provide the event name, type and accessibility. The parameters can be defined for the events using the parameter button.

Constructors:

Instance Constructor: It will be called during the creation of the object.

Class Constructor: It will be calledduring the call of the static method.

Destructor: It will be called for the deletion of the object.

Figure 6 Constructor

How to compare two tables of data using ABAP

TYPES: BEGIN OF star,

star_name type c length 50,

END OF star.

DATA star_2018 TYPE star.

DATA star_2019 type star.

DATA it_table_2018 TYPE STANDARD TABLE OF star.

DATA it_table_2019 TYPE STANDARD TABLE OF star.

FIELD-SYMBOLS <star_2018> LIKE LINE OF it_table_2018.

FIELD-SYMBOLS <star_2019> LIKE LINE OF it_table_2019.

star_2018-star_name = ‘Logan paul’.

APPEND star_2018 TO it_table_2018.

star_2018-star_name = ‘pewdiepie’.

APPEND star_2018 TO it_table_2018.

star_2018-star_name = ‘jacksepticeye’.

APPEND star_2018 TO it_table_2018.

star_2018-star_name = ‘vanoss gaming’.

APPEND star_2018 TO it_table_2018.

star_2018-star_name = ‘markiplier’.

APPEND star_2018 TO it_table_2018.

star_2018-star_name = ‘jeffree star’.

APPEND star_2018 TO it_table_2018.

star_2018-star_name = ‘Dantdm’.

APPEND star_2018 TO it_table_2018.

star_2018-star_name = ‘dude perfect’.

APPEND star_2018 TO it_table_2018.

star_2018-star_name = ‘jake paul’.

APPEND star_2018 TO it_table_2018.

star_2018-star_name = ‘Ryan toysreview’.

APPEND star_2018 TO it_table_2018.

star_2019-star_name = ‘preston’.

APPEND star_2019 TO it_table_2019.

star_2019-star_name = ‘pewdiepie’.

APPEND star_2019 TO it_table_2019.

star_2019-star_name = ‘ryan kaji’.

APPEND star_2019 TO it_table_2019.

star_2019-star_name = ‘vanoss gaming’.

APPEND star_2019 TO it_table_2019.

star_2019-star_name = ‘markiplier’.

APPEND star_2019 TO it_table_2019.

star_2019-star_name = ‘jeffree star’.

APPEND star_2019 TO it_table_2019.

star_2019-star_name = ‘Dantdm’.

APPEND star_2019 TO it_table_2019.

star_2019-star_name = ‘Rhett and link’.

APPEND star_2019 TO it_table_2019.

star_2019-star_name = ‘Anastasia’.

APPEND star_2019 TO it_table_2019.

star_2019-star_name = ‘dude perfect’.

APPEND star_2019 TO it_table_2019.

LOOP AT it_table_2019 ASSIGNING <star_2019>.

     READ TABLE it_table_2018 WHERE star_name = <star_2019>-star_name.

     IF sy-subrc <> 0.

      WRITE: \ <star_2019>-star_name.

     ENDIF.

ENDLOOP.

RESULT:

preston

Rhett and link

Anastasia

Why and when to use constants.

CONSTANTS: BEGIN OF changes_2020,

new type string ‘N’,

old type string ‘O’,

END OF changes_2020.

The above example shows that the constants can be used for better understanding of program.

for example instead of saying just the letter ‘N’, we can say new. so the reader of the code, can easily understand the significance of the value. It improves the readability of the code.

“changes_2020-new” mentions that is new.

Value help ABAP

Search help in data table

•The way, the input help defined can be verified under the Entry help/check tab of the data table. The respective column to be checked is „origin of the input help“.

•Data Element –> Explicit search help attachment to data element

•Domain–>Input help with fixed values, input help based on data type

•If the domain refers to a value table, then the error message always appears from the SAP. It cannot be changed, unless a new similar domain is created and assigned to the data element.

ABAP Dictionary explained with Groceries list

In this article we are going to see about ABAP Dictionary. The data is administered centrally in the SAP system using the ABAP Dictionary. The transaction for the ABAP Dictionary is SE11. The following ABAP Dictionary objects are involved in SE11 transaction.

  • Domain
  • Data Element
  • Structure
  • Table type
  • Database table
  • Type groups
  • Views
  • Search help
  • Block Concept

Now the ABAP Dictionary concepts are explained with list of groceries example.

  • Create a Domain
  • Create a Data Element
  • Create Structure
  • Create Data Table

I want to manage and administer the groceries list. Therefore I want to create a data table which stores the list of groceries.

Here are the frequently used items in my grocery list.

  1. Bread
  2. Butter
  3. Honey
  4. Rice
  5. Eggs
  6. Chicken
  7. Tomato
  8. Onion
  9. Olive oil
  10. Pepper
  11. Milk
  12. Coffee
  13. Plant based milk
  14. Tomato Bio
  15. Chicken Nuggets

I listed these items in a table and figured out that the names are not unique. For example 7 and 14 are tomato. But they are of different type. Similarly 6 and 15 are of type chicken, 11 and 13 are of type milk. In order to make the items unique, I want to give a unique no to each grocery item. Say I start with 1000,1001,…. So for Bread, Item Id is 1000. Now comes the question , how many packets of Bread do I buy in a week or during a single purchase. The items onion, rice etc. are measured in kilograms. The item such as milk are measured in litre etc.

We have now identified the data in the groceries list. For example,

Item Id –>1000

Name of Item –>Bread

Size of Purchase –>2 Packets

Unit of Purchase –> Packets

Now let’s have a short look at Data types in ABAP Dictionary. The frequently used data types in ABAP are CHAR,NUMC,DEC,INT1,INT2 and INT4.

The figure shows how different data can be defined using different data types.

Domain:

Let us create four different domains.

Item Id => ZDOM_Item_Id=>CHAR (Length=4)

Name of Item=> ZDOM_Item_Name=>CHAR(Length=100)

No.of Items=> ZDOM_No_Items=>Int4

Unit of Purchase=>ZDOM_Unit=>UNIT

Data Element:

The Data Element depicts the column name or the field name. So create four different data elements from the respective domains.

Item Id => ZDE_Item_Id=>ZDO_Item_Id

Name of Item=> ZDE_Item_Name=>ZDO_Item_Name

No.of Items=> ZDE_No_Items=>ZDO_No_Items

Unit of Purchase=>ZDE_Unit_of_Purchase=> ZDO_Unit_of_Purchase

In the field description of the data element give a meaningful name. This text appears in the user interface. The text must also be translated into respective language, if the application is maintained in different languages.

Data Table:

Finally, we arrive to the Data table creation section. The fields are defined in the data table with corresponding data elements.

ZDT_ITEM_LIST

Field NameData Elements
Item_IdZDE_Item_Id
Name_of_ItemZDE_Item_Name
No. of ItemsZDE_No_Items
Unit_of_PurchaseZDE_Unit_of_Purchase

Structure:

The items in the list can be structured using structures in ABAP.

So let’s create a structure

ZST_ITEM_LIST

Structure FieldsData Elements
Item_IdZDE_Item_Id
Name_of_ItemZDE_Item_Name
No. of ItemsZDE_No_Items
Unit_of_PurchaseZDE_Unit_of_Purchase

It is clearly evident, that the structure and Data table may look similar in construction. For Beginners, this will always be a confusion. One of the key difference between Data tables and structures is that a structure will always hold a single line of record. But whereas a Data table will hold a series of records. Below is the pictorial representation.

DATA TABLE

Item IdName of ItemNo. of ItemsUnit of Purchase
1000Bread2Packets
1001Rice2Kg
1002Onion1,5Kg

Structure => 1000, Bread, 2, Packets (Single Line of Record)

Table Type:

A table type can be defined from the structure. In order to achieve that, simply define a line type as the structure

ZTable type_Items => Line Type–>ZST_Item_List

This is how data can be managed and maintained in a data table. ABAP provides a structured way of managing the data in data tables using the Development objects such as Domain, Data Element, Structures and Data tables.

References:

SAP ABAP OBJECTS by Felix Roth