While working with javascript we often use this popular method console.log(). During debugging when we need some insight about the happenings we use console.log(). There are a lot more methods to debug your code alternative to console.log(). These alternative console.log() methods are useful in data visualization, debugging etc.,
Alternative to console.log():
1.console.table()
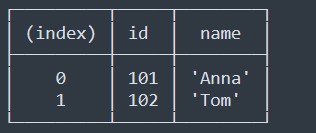
This console.table() method is useful when we want to get a visual form of a group of objects that can be represented in a tabular form. It takes one mandatory argument data, which must be an array or an object, and one additional optional parameter columns. For example let us take 2 employee details and see in console.log() and console.table() methods
Using console.log():
const employee = [{id:101, name:'Anna'},
                    {id:102,name:'Tom'}];
console.log(employee);


Using console.table();
const employee = [{id:101, name:'Anna'},
                    {id:102,name:'Tom'}];
console.table(employee);

2.console.assert()
This console.assert() is great for debugging process. It takes an assertion and writes an error message when the assertion is false. If it is true nothing happens. Mainly used while debugging code. For example lets check whether a number is even and throw an error message if it is not.
const isEven = n => n % 2 === 0;
for (let i = 0; i < 3; i++)
{
    console.assert(isEven(i), '%s is not even!', i);
}


3.console.count()
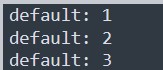
console.count() is used to count the number of times the line has been called.
for (let i = 0; i < 3; i++){
    console.count();
}

4.console.trace()
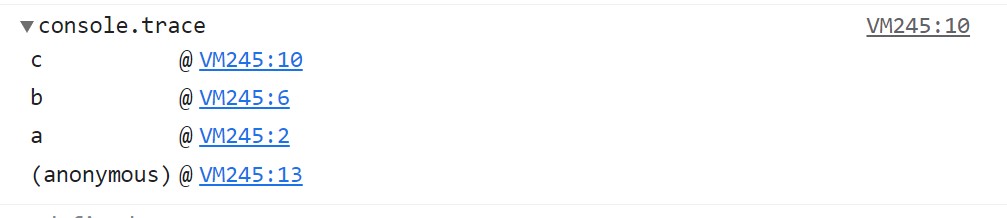
console.trace() helps you output the current stack trace at the location where you call it from. This helps in displaying a trace that show how the code ended up at a certain point.
function a() {
  b();
}

function b() {
  c();
}

function c() {
  console.trace();
}
a();

5.console.error()
console.error() is the second most popular method. It displays the error message.
console.error('This is an error message');

6.console.dir()
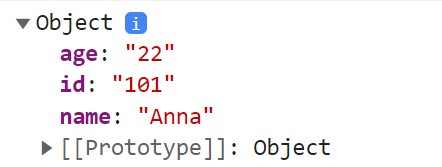
This method console.dir() will display the interactive view of the objects we want to log.
const employee ={
    name: 'Anna',
    age:'22',
    id:'101'
}
console.dir(employee);

7.console.warn()
console.warn() displays the warn message in yellow color.
console.warn('This is a warning message');

8.console.time()
console.time() is used to measure how long a particular operation in a program takes. This starts a timer you can use to track the time of a particular operation
console.time();

for (let i = 0; i < 100; i++) {
  // some code
}
console.timeEnd();


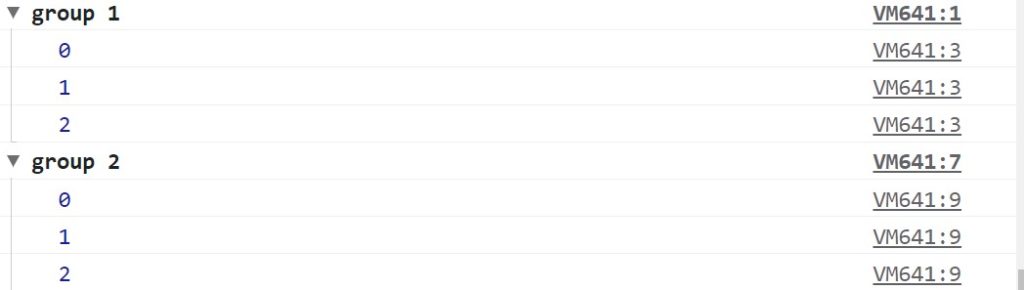
9.console.group()
console.group adds a level of indentation to any methods that comes after it. console.groupEnd() resets the indentation to the level it was before.
console.group('group 1');
for (let i = 0; i < 3; i++) {
    console.log(i);
}
console.groupEnd('group 1');

console.group('group 2');
for (let i = 0; i < 3; i++) {
    console.log(i);
}
console.groupEnd('group 2');