How to do type conversion and type casting?

In this article, you will learn about the Type conversion and type casting in Python. Before learning type conversion in python, you should have knowledge about Python data types. To know about the data structures in python click here!

Type Conversion:

            Python is a dynamically typed language, which means that we do not have to specify the data type of a variable we are assigning. The Python interpreter automatically understand the type of variables and assign data types accordingly. Type conversion is the process of converting one data type to another. It can be any data type like integer, float, string, list or dictionary. There are two types of type conversion

  1. Implicit Type conversion.
  2. Explicit Type conversion(Type casting).
Implicit Type Conversion:

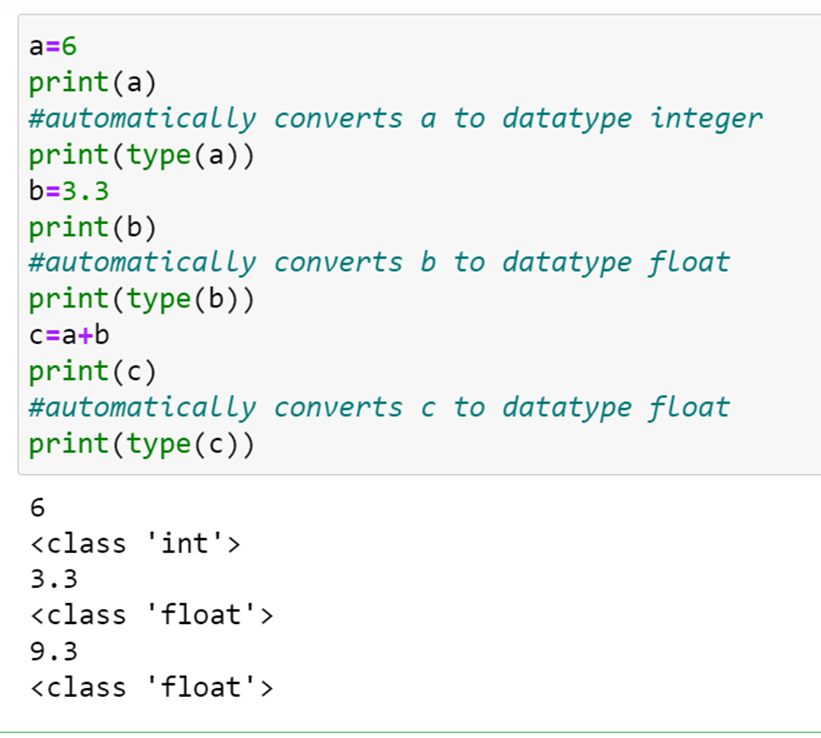
In implicit type conversion, the python interpreter itself automatically converts the data type of a variable from one type to another without intervention of the user. Now let us see with an example code snippet how python interpreter converts a lower data type (int) to higher data type (float) to prevent data loss. This type of conversion is called upcasting.

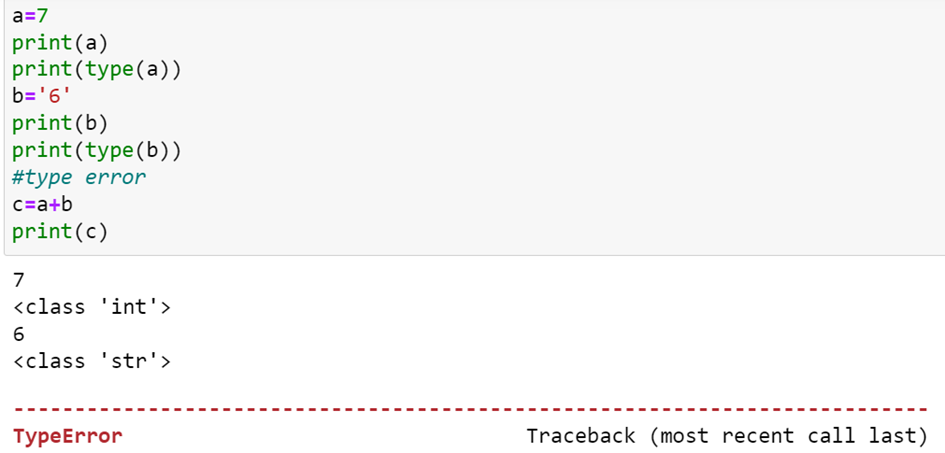
Now a question may arise what will happen if we try to add an integer and a string with + operator then we will get Type error. This is illustrated in the following code snippet.

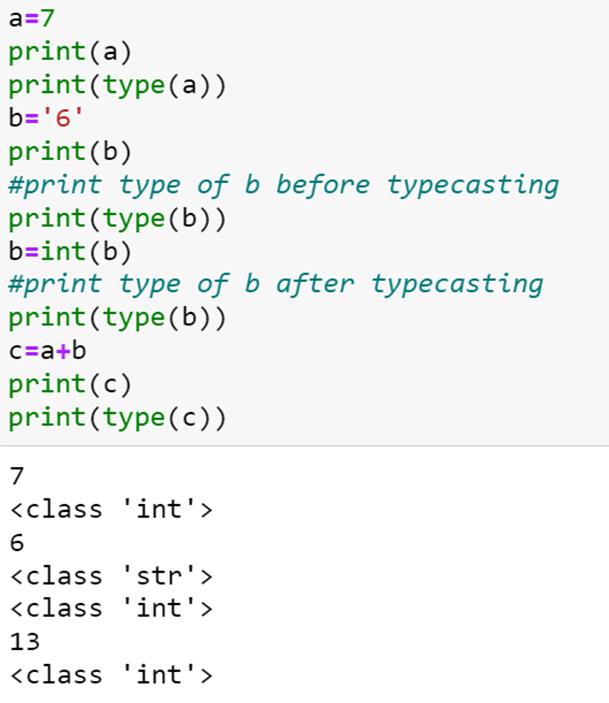
However, we have a solution for this in explicit type conversion

Explicit Type conversion (Type casting):

            In this method, python needs user involvement for converting one data type to another. The predefined functions in python to perform explicit type conversion are int(), float(), str(), bool().

Syntax:

            (Required datatype) (Expression)

Now we will see some in-built Python functions and their descriptions

FunctionDescription
Int(x[base])It converts x to an integer, and Base specifies the number base. For example, if you want to convert the string in decimal numbers then you’ll use 10 as base.
Float(x)It converts x to a floating-point number
Str(x)Converts x to string
Tuple(x)Converts x to tuple
List(x)Converts x to list
Set(x)Converts x to set
Key Points to remember in Type conversion:
  1. Type conversion is the conversion of objects from one datatype to another.
  2. Implicit conversion is automatically performed by Python interpreter without loss of data.
  3. Explicit conversion also called as type casting is performed by involvement of user and data loss may occur as we enforce object to a specific data type.

These are all the things we need to note in type conversion. Most of the time implicit conversion will do its job. If we still need to convert to another datatype then explicit conversion is used.

How to visualize data in Python using bokeh library

We have seen in the previous article about data visualization and the one of the libraries matplotlib used in Python for visualization. Now let us cover another one Bokeh library clearly with example.

          Bokeh is a Python native library that allows you to create interactive web-based plots. Bokeh renders its plots using HTML and Javascript providing high level interactivity.

          The fundamental behind Bokeh is that graphs are built up one layer at a time. It provides different level of interfaces to users to choose  from basic plots with very few customization to high level advanced plots with full control over visualization.

          Typically the interfaces are divided into two levels.

  • bokeh.plotting: The intermediate level interface that is comparable to matplotlib. It provides functions to create figures and glyphs for a plot/graphic.
  • bokeh.model: This provides a low level interface that provides high-end flexibility to the application developers. This interface provides complete control over how the Bokeh plots are assembled, configured, and displayed.

Installing the Bokeh Library:

Install the Bokeh library with the following command.

pip install pandas-bokeh

conda install bokeh

After installing packages now let us see two examples. Bokeh offers wide variety of ways to produce interactive outputs. The most common ones are:

  • output_file( )

Generate simple standalone HTML documents for visualization.

  • output_notebook( )

Display output in Jupyter/Zeppelin Notebooks.

Let us see examples of implementing Bokeh library in Python First we will see a basic graph of drawing some points with glyphs

from bokeh.plotting import figure, output_file, show
p=figure(width=400, height=400, tools="pan,rest,save")
p.circle([1,3,5,2,3],[2,3,1,2.5], radius=0.2, alpha=0.5)
output_file("sample2.html")
show(p)

Plotting Graph with CSV File

Now we will try to read data from CSV file.

from bokeh.plotting import figure
from bokeh.io import output_file, show
import pandas
df=pandas.read_csv("sample1.csv")
x=df["x"]
y=df["y"]
output_file("sample1.html")
fig1=figure(width=300, height=300, tools="pan,reset,save")
fig1.line(x,y)
show(fig1)

In this article we have seen the Bokeh library with examples like basic graph visualization and extracting data from csv file and visualizing it.

How to visualize data using matplotlib library

Data Visualization

Data Visualization is a fundamental step involved in the activities of a data scientist. It is a process of projecting complex information in a visual form or context to give more understanding and insights.

It communicates the relationships of the data with images. This is important because it allows trends and patterns to be more easily seen.

It helps turn complex numbers into a story that people can easily understand.

Primary uses include

  • Explore data
  • Communicate data

In this article let’s explore the matplotlib library in python.

matplotlib:

A wide variety of tools exist for visualizing data like matplotlib, pandas visualization, seaborn, ggplot, plotly.

Today we will explore matplotlib

It is the most widely used package for 2D graphics. It is low level and provides lot of freedom.

As matplotlib is not part of the core python library first we need to install it using the command

python -m pip install matplotlib

We will be using matplotlib.pyplot module.

How to plot a line chart using matplotlib?

Line chart is useful in tracking changes over short and long periods of time. When smaller changes exist, line charts are better to understand. It is also useful in comparing changes over same period of time for more than one group.

Syntax:

import matplotlib.pyplot as plt

plt.plot(x_values,y_values)

Here x_values means values to plot on the x-axis and y_values means values to plot on the y-axis.

Example:

Now let us see the number of employees in Company A for the last five years.

import matplotlib.pyplot as plt

# number of employees

emp_count = [325, 400, 530, 605, 710, 600]

year = [2016, 2017, 2018, 2019, 2020, 2021]

# plot a line chart

plt.plot(year, emp_count,'o-g')

#set axis titles

plt.xlabel("Year")

plt.ylabel("Employees")

#set chart title

plt.title("Employee Growth")

plt.show()

Output:

How to chart multiple lines in a single chart?

Now let us consider two companies A and B and its employee growth for the same time period.

import matplotlib.pyplot as plt

# number of employees

emp_count_A = [325, 400, 530, 605, 710, 600]

emp_count_B = [225, 310, 360, 300, 450, 560]

year = [2016, 2017, 2018, 2019, 2020, 2021]

# plot a line chart

plt.plot(year, emp_count_A,'o-b')

plt.plot(year, emp_count_B,'o-r')

#set axis titles

plt.xlabel("Year")

plt.ylabel("Employees")

#set chart title

plt.title("Employee Growth")

#legend

plt.legend(['A', 'B'])

plt.show()

Output:

In this above example both lines share the same axis. So to distinguish them we have used legends.

In the above two examples in addition to the values for x and y axis we have third argument ‘o-g’ which means format string. These are abbreviation for quickly setting line properties.

A format string consists of three parts ‘[marker][line][color]’ with each of them being optional.

To know about bokeh library click here!

IS PYTHON A PROGRAMMING OR SCRIPTING LANGUAGE?

Before getting into the question of whether Python is a programming language or scripting language. First, we will try to get some basic understanding of programming and scripting languages along with the differences between them then we can easily come to a conclusion or solution to our question.

         Python is designed and developed by Guido Van Rossum in 1991. It is the most popular for machine learning tasks. Being a Python beginner, a lot of questions come to our mind like is it a programming language or interpreter or scripting language. The simple answer to this question is yes. It is more than a scripting language. It is also an interpreted, object-oriented, high-level programming language. But in this article let us find out how?

What is scripting language?

         The scripting language is a programming language designed to interact with other programming languages. They are often interpreted and not compiled. Not all programming languages are scripting languages, but all scripting languages are programming languages.

Difference between scripting and programming languages

         As I mentioned before, all programming languages are not scripting languages, but all scripting languages are programming languages.

Now let us try to understand the key difference between scripting and programming languages. In both the difference is due to compiler and interpreter.

Compiler: First converts the program into assembly code and then to machine code.

Interpreter: It converts and executes the program line by line.

Like JavaScript Python does not require compilation whereas C++ requires compilation.

Scripting languages are used to create websites whereas programming languages are used for software creation. Scripting languages are slower than programming languages since it is executed line-by-line. It also uses less code.

         Using Python, we can write scripts to automate simple tasks and also complex programs like web applications, data analysis tools APIs and much more. It is very popular in Data Science and Artificial Intelligence.

         So, Python is a Programming language that uses scripts which can be compiled and run-in real-time Python interpreter, thus acting like both a compiled programming language and scripting language.

How to do Sorting and grouping in ALV Table through CL_SALV_SORTS

The sorting and grouping of data in ALV Table can be programmatically achieved. The method add_sort( ) of the class CL_SALV_SORTS can be used to sort or group the data. This sorting object is created from the get_sorts( ) method of the ALV Object.

DATA lr_salv_sorts TYPE REF TO cl_salv_sorts.

Lr_salv_sorts = lr_salv_table->get_sorts( ).

Lr_salv_sorts->add_sort( EXPORTING columnname = ‘AGE’

                                                          sequence       = if_salv_c_sort=>sort_up ).

The following sorting and grouping options are available.

If_salv_c_sort=>sort_none.

If_salv_c_sort=>sort_up.

If_salv_c_sort=>sort_down.

If_salv_c_sort=>group_with_underline.

If_salv_c_sort=>group_with_newpage.

If_salv_c_sort=>group_none.

How to do Aggregation using the class CL_SALV_AGGREGATION

The column of the ALV Display can be aggregated using the add_aggregation( ) method of the class CL_SALV_AGGREGATION.

DATA lr_salv_aggregation TYPE REF TO cl_salv_aggregation.

Lr_salv_aggregation = lr_salv_table=>get_aggregations( ).

Lr_salv_aggregation->set_aggregation_before_items( abap_true ).

Lr_salv_aggregation->add_aggregation( columnname = ‘AGE’

                                                                aggregation  =  if_salv_c_aggregation=>average ).

The following aggregation types are available.

If_salv_c_aggregation=>minimum.

If_salv_c_aggregation=>maximum.

If_salv_c_aggregation=>average.

If_salv_c_aggregation=>total.

If_salv_c_aggregation=>none.

How to fill icons in SAP ALV Display of type CL_SALV_TABLE

In order to fill icons in ALV Table, we must add an additional field of type ICON_D. The type ICON_D is of datatype CHAR with length 4. This is later filled with the icon code.

Step1: Define the icon field

TYPE-POOLS: icon.

TYPES: BEGIN OF ty_contact.

                  INCLUDE STRUCTURE ztt_db_table2.

                  TYPES: icon_field TYPE icon_d,

               END OF ty_contact.

Step2: Fill the internal table with data contents.

DATA lt_contact TYPE TABLE OF ty_contact.

SELECT * FROM ztt_db_table2 INTO TABLE lt_contact.

Step3: Fill the internal table with icon code.

FIELD-SYMBOLS <ls_contact> TYPE ty_contact.

LOOP AT lt_contact ASSIGNING <ls_contact>.

               <ls_contact>-icon = icon_positive.

ENDLOOP.

How to color the cells of SAP ALV Display of type CL_SALV_COLUMNS_TABLE

Step 1:

Desired cells of the SAP ALV Display can be colored using the structure lvc_s_scol. The color codes must be set to each line of record. Therefore the structure of the ALV Display must be extended with the additional field with an internal table of type lvc_t_scol.

TYPES: BEGIN OF ty_contact.

              INCLUDE STRUCTURE ztt_db_table2.

              TYPES: color_field TYPE lvc_t_scol,

              END OF ty_contact.

DATA ls_color_field TYPE lvc_s_scol.

DATA lr_all_columns TYPE REF TO cl_salv_columns_table.

DATA lt_contact TYPE TABLE OF ty_contact.

SELECT * FROM ztt_db_table2 INTO TABLE lt_contact.

Lr_all_columns = lr_salv_table->get_columns( ).

Step2:

Make the ALV Table recognize the newly added ‘color_field’ with the help of the method set_color_column( ) of class CL_SALV_COLUMNS_TABLE.

Lr_all_columns->set_color_column( ‘COLOR_FIELD’ ).

Step3:

Finally fill the internal table ( new field ) with the desired color codes.

DATA ls_contact TYPE ztt_db_table2.

LOOP AT lt_contact ASSIGNING ls_contact WHERE age > 30.

              Ls_color_field-fname = ‘CONTACT_ADDRESS’.

              Ls_color_field-color-col = 7.

              Ls_color_field-color-int = 1.

              Ls_color_field-color-inv = 1.

              APPEND ls_color_field TO ls_contact-color_field.

ENDLOOP.

How to color the complete column of the SAP ALV Display of type CL_SALV_COLUMN_TABLE

The method set_color of the class CL_SALV_COLUMN_TABLE can be used to color the column of SAP ALV Display.

The color codes are much similar to old ALV Display of type CL_GUI_ALV_GRID

DATA lr_all_columns TYPE REF TO cl_salv_columns_table.

DATA lr_single_column TYPE REF TO cl_salv_column_table.

Lr_all_columns = lr_salv_table->get_columns( ).

Lr_single_column ?= lr_all_columns->get_column(‘CONTACT_NAME’).

DATA ls_color_column TYPE lvc_s_scol.

Ls_color_column-col = 7.

Ls_color_column-int = 1.

Ls_color_column-inv = 1.

Lr_single_column->set_color( value = ls_color_column ).

The column ‘Contact_name’ is colored or highlighted in orange colour.

The following table shows the other different colour codes. It is same as the old ALV Display.

Colorcolor_codecolintinv
GreenC510510
RedC610610
OrangeC711711
Color Codes

Difference between SQL and NoSQL

In this article let us see about basic differences between SQL and NoSQL and try to understand the structure of both database models.

 SQLNoSQL
Data ModelRelational model.Structured database. Stores data in tablesNon-Relational model. Semi-Structured database. Stores data in JSON documents, graphs, key value pairs, column based.
Query LanguageStructured Query LanguageNo declarative query language.
SchemaPredefined or StaticDynamic
Popular Database SystemsMySQL, PostgreSQL, Oracle, MS-SQLMongoDB, Apache HBase, Cassandra, Amazerticalon DynamoDB
ScalingVerticalHorizontal
TransactionACID (Atomicity, Consistency, Isolation, Durability)BASE (Basically Available, Soft state, Eventual Consistency)
FlexibilityNot very flexible in terms of designVery flexible in terms of design
ExampleSELECT id, name, address FROM students WHERE age>12 LIMIT 5db.students.find( {age:{$gt:18}}, {name:{1,address:1} ).limit(5)

Relational

SQL
NoSQL

In the above images we can understand the models of SQL and NoSQL databases.

If your application has fixed structure and does not require frequent modifications  then SQL is best. But if your application is rapidly changing and growing like in big data analytics then NoSQL is best.